
Roleplay performance analytics
The Roleplay Performance dashboard gives managers and admins a view across their team's practice activity, scorecard results, course progress, and coaching. Go to Performance in the left sidebar.
Dashboard tabs
Performance has three views in the left sidebar: Activity, Scorecards, and Practice. Each view is divided into tabs covering a different dimension of performance:
- Performance > Activity
- Team Activity: session volume, average scores, talk/listen ratios, question rates, and engagement metrics across all roleplays.
- Comments: a log of manager feedback left on roleplay sessions.
- Performance > Scorecards
- Scorecards: scorecard criterion-level results across the team; identify which specific skills team members are passing or failing.
- Performance > Practice
- Batches: completion and performance data filtered by course batch (cohort).
- Courses: completion and progress data for courses.
- Call Blitz: leaderboard and per-agent results for all blitz sessions.
- Workflows: AHT, resolution, and step accuracy data from workflow training completions.
- Roleplay Agents: usage and performance data broken down by individual agent.
Metrics in Team Activity
The Team Activity tab shows a row for each team member with the following columns: average score, total sessions, average session duration, talk/listen ratio, question rate, longest monologue, longest customer story, interactivity, and roleplays scored.
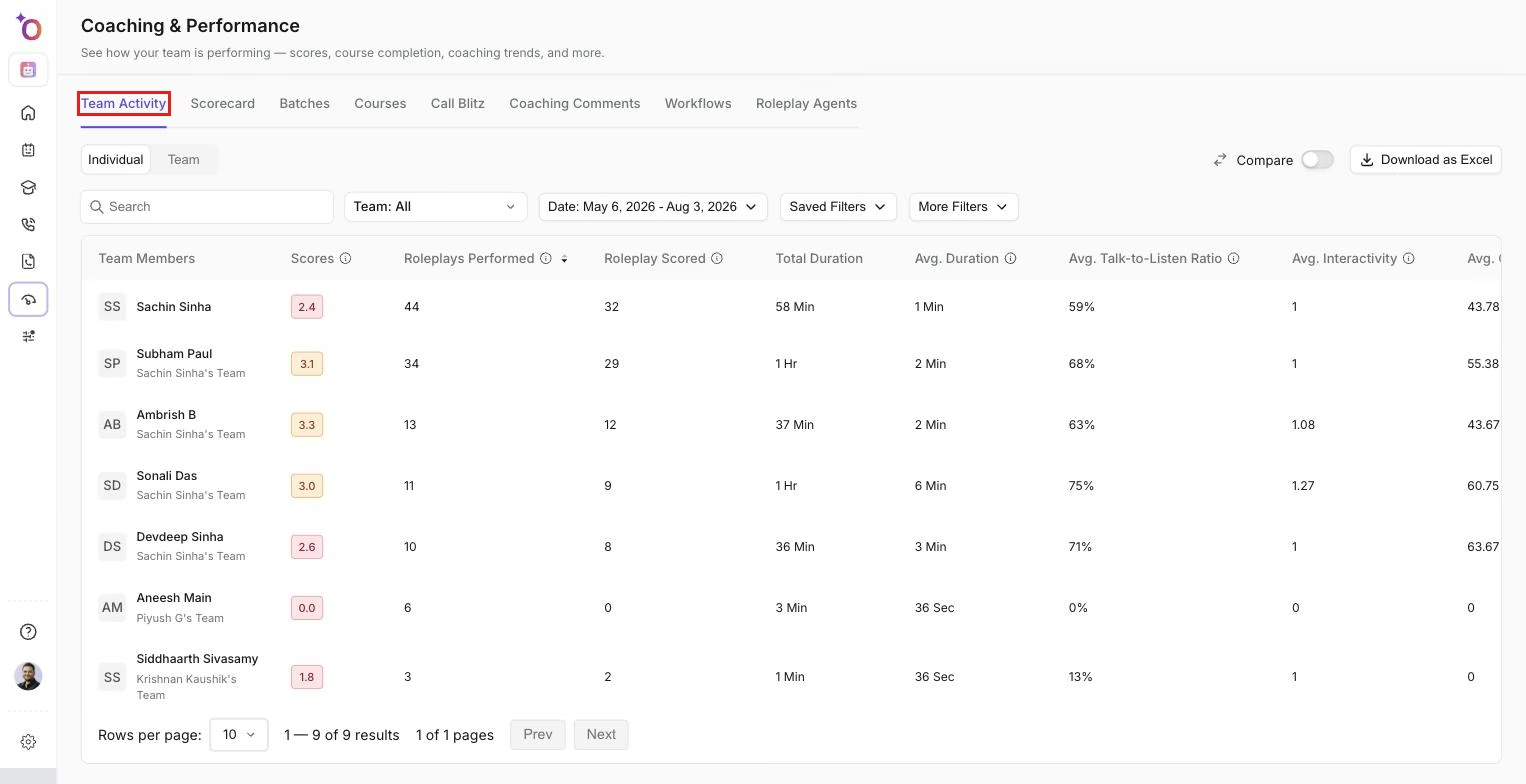
The Team Activity tab, showing the per-team-member metric columns listed above.
Click any team member's row to drill into their individual session history.
Filters
- Date range: set a primary period to analyse; optionally enable a comparison period to see change over time.
- Team / Manager: filter to a specific manager's direct reports.
- Scoring type: filter to sessions scored by AI only, by a manager only, or all scored sessions.
- Search: find a specific team member by name.
Exporting data
Click Export on any tab to download the visible data as an Excel file. The export includes all metric columns and manager assignment data. File name format: performance_data_YYYY-MM-DD.xlsx.
How to use the dashboard
A few common use cases:
- Identify lagging skills: use the Scorecards tab to find criteria where pass rates are consistently low across the team; those criteria point to training gaps.
- Track improvement: set a comparison date range in Team Activity to see whether scores and engagement metrics improved after a training program.
- Prep for 1:1s: drill into an individual team member's session history before a coaching conversation to have specific examples ready.
- Measure a blitz: after running a Call Blitz, check the Call Blitz tab to see who completed it, their scores, and which agents had low success rates.
Hope this article was helpful. For any queries, please write to support@outdoo.ai